T-Plan Robot Enterprise 4.4.7 Script Editor
Contents
1. Script Editor Overview
2. Editor Context Menu
3. Writing Test Scripts
4. Compiling Test Scripts
5. Executing Test Scripts
1. Script Editor Overview
Script editor allows to create and edit test scripts. It is a
standard text editor with additional features designed to
facilitate easy writing and execution of test scripts. Editors are
organized in a tabbed pane in the left bottom part of the GUI.
Each editor consist of three main components:
- The Enclosing tabbed pane
serves as the editor container. The tab name is always set to
the script file name. If the editor content has been modified,
an asterisk gets appended to the name. If the editor content
hasn't been saved to a file yet, the tab text is set "Untitled".
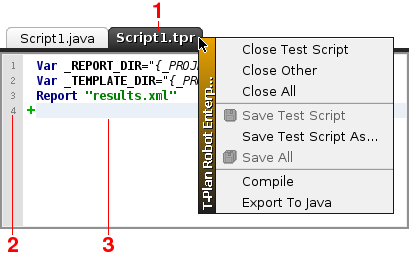
When you hover your mouse pointer over the tab text, it displays
a tool tip message with the full script file path. The tab also
provides a context menu on a right mouse click with a selection
of actions available in the main GUI File menu, such "Close Test
Script" or "Save Test
Script".
- The Editor gutter provides line numbering and allows
to define break points to suspend (pause) the script execution
at.
- The Code Editor is a standard text editor featuring:
- The code syntax highlighting improves readability of
the code and helps to distinguish individual elements of the
script language (TPR or Java). The color scheme can be
customized in the Script
Editor panel of the Preferences
window.
- The Editor Context Menu provides access to selected
actions of the script and/or the particular script element (a
command or a Java method call) at the current line. See the Editor Context Menu chapter
for details.
- The Command and Code Template Wizards provide a
comfortable GUI assisted way to create scripting language
commands or even fragments of code (snippets). See the Writing Test Scripts
chapter for details. This functionality does not apply to Java
test scripts.
- The Script Execution Support allows to control and
debug execution of a test script. As the editor closely
cooperates with the underlying test script interpret, it allows
to restrict execution just to a subset of commands, trace the
execution progress, set up and activate break points or even
enter into a mode where just one command is executed at a time
(Step Execution). See the Compiling
and Executing Test Scripts
chapters for details.
The Java test script editor supports two additional script views:
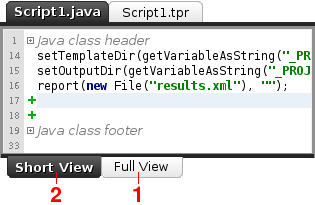
- The Full View
displays the whole Java class.
- The Short View displays just the contents of the test()
method (or the main try/catch block inside the method) which
represents the test script body. The rest of the Java class is
collapsed into the Java Class Header
and Java Class Footer nodes. These can be
eventually expanded through a click onto the + box.
The Code Editor supports all usual editing functionality plus a
number of specific actions as follows. The short cut keys marked
with a green asterisk can be configured through the editor
Preferences (see the Editor Context Menu
chapter).
Action Name
|
Short Cut Key
|
Description
|
Undo
|
Ctrl+Z |
Undo the last edit.
|
| Redo |
Ctrl+Y |
Redo the last undone edit.
|
Copy
|
Ctrl+C |
Copy the selected text into the system clipboard.
|
Cut
|
Ctrl+X |
Cut the selected text into the system clipboard. |
Paste
|
Ctrl+V |
Paste the system clipboard content into the
current position.
|
Search/Replace
|
Ctrl+F |
Search for or replace a string in the editor.
|
Go To Line
|
Ctrl+G |
Go to the specified line number.
|
Comment Out
|
Ctrl+/
(slash)*
|
Comment out or uncomment the selected code
block.
|
Toggle
Breakpoint
|
Ctrl+B* |
Create/remove a break point.
|
Context Menu
|
Ctrl+Shift+Enter* |
Open the editor context menu (same as a mouse
right click).
|
Command Wizard
|
Ctrl+Enter* |
Open the Command Wizard menu.
|
Code Template
Wizard
|
Ctrl+I
|
Open the Code Template Wizard list.
|
New Script
|
Ctrl+N
|
Create a new test script in a new editor.
|
Open Script
|
Ctrl+O
|
Open a test script in a new editor.
|
Save Script
|
Ctrl+S
|
Save the current test script.
|
Close Script
|
Ctrl+W
|
Close the current test script.
|
Compile Script
|
F9
|
Compile the current script.
|
Run Script
|
F6 |
Execute the current script.
|
Export To Java
|
Ctrl+J |
Convert the script to Java through the Java Converter (TPR scripts
only).
|
Most of these features are also available in the File and Edit
menus of the main GUI.
2. Editor Context Menu
The context menu is accessible through a right mouse click onto a
text line of the text editor component. Another alternative is to
press Ctrl+Shift+Enter.
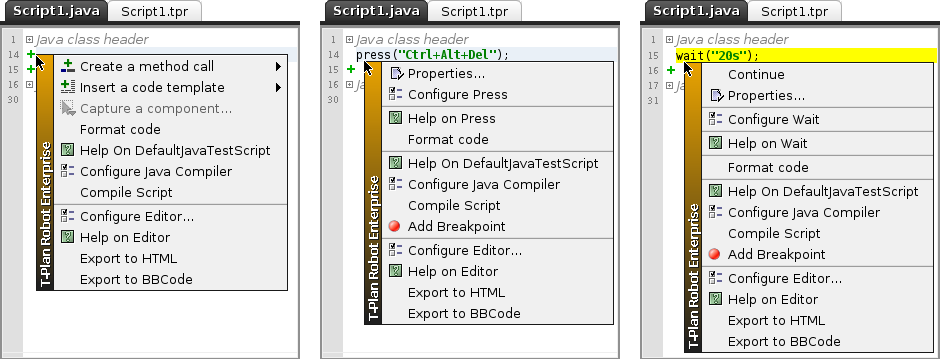
The menu contains three types of actions:
- Stable
editor
actions such as Compile Script and Configure
Editor. These are always available, usually at
the bottom of the menu.
- Context
actions are associated with the text element on the
current line.
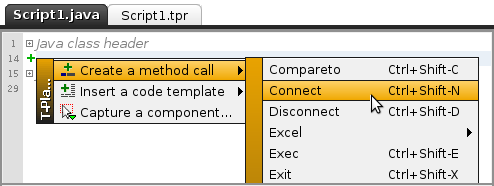
- If the line is empty the menu
provides access to the Command and Code Template
Wizards. The action called Capture a
component... allows to save a component
image from the screen to a file and create a script action on
that component.
- If the line contains a valid TPR
command or a Java
Test Script API method call the menu contains the
command actions. The Properties actions allows to
edit the command/method call with the parameter editor. If the
command relies on configurable parameters there's the Configure
<command> action.
- Some of the
commands/method calls define additional context or execution
specific actions. For
example, the Continue action of the Wait command is a
dynamic action available only during the command execution
and it allows to resume the script immediately.
3. Writing Test Scripts
The editor is equipped to support easy script writing even for
those users who are not fully familiar with the scripting
language. The following work flow is recommended for writing of
test scripts:
- It is highly recommended to
configure the script to use the project template and report paths and to create
an XML file (so called "report") with the test results. See the
Project View topic for details.
- Use the Component Capture feature to create
whole blocks of actions working with the screen recognition. For
a finer development take advantage of the Command Wizard (Ctrl+Enter or right
click->Create
a command/method call) to create atomic script
operations.
Alternatively use the script recording feature to
generate the basic flow of mouse and keyboard events in your
script. See the Script Recorder
help topic for details. Then perform manual adjustments to the
generated code - modify timeouts, merge commands, create
reusable procedures or parametrize command arguments through
variables where necessary.
- As you record, define points of verification
when it is appropriate to verify content of your remote desktop
and/or existence of a component using image comparison. Stop
recording at each such a point and take advantage of one of the
Component Capture wizard to create
the component image and to create the script action on the
component. Alternatively use the CompareTo,
Screenshot or WaitFor Wizards to create the template
image and to set up an atomic comparison operation in the
script.
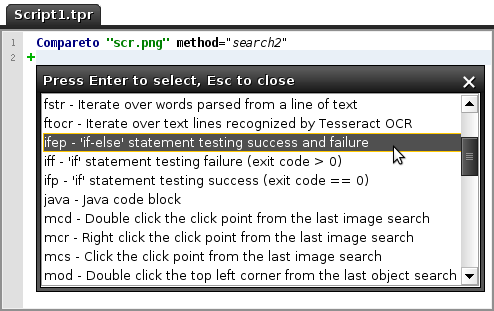
- Often used fragments of script code
can be easily created through the Code Template Wizard (Ctrl+I or right click->Insert a code
template). There's a template editor allowing to create
custom templates as well. See the Code
Templates topic for details.
- Once the basic automation code is in
place, decide how you want to report
the
results. The Tool Panel
allows you to define where to save the test results (report) and
in which format. To create screen shots insert Screenshot command
instances into appropriate locations of your test script. The Screenshot Wizard is designed to
help you to create the command without having to know the
command syntax.
- To modify the script right click the
command or the method call you wish to modify and select the Properties
item to open the parameter editor.
4. Compiling Test Scripts
Each script is compiled before execution and eventually after
modification. This task is performed automatically by an object
called test script interpret.
- TPR test scripts do
not really compile because their code is interpreted. The
compilation is limited to checking of the script for syntax
errors and verifying of existence of dependencies and resources
(images, libraries, ...).
- Java test scripts have
to be on the other hand compiled into byte code (.class) through
the
javac Java compiler. If Java Development Kit (JDK) is used as
a runtime for T-Plan Robot Enterprise, the tool is able to compile the Java
code seamlessly in the memory and execute it without even saving
the byte code to a file.
The editor cooperates with the underlying test interpret on
compilation of by supporting:
- On-demand
compilation can be invoked through the Compile
menu item either from the editor context
menu or the main GUI Script
menu.
- On-the-fly
compilation is performed automatically after each
script modification and the configured idle time. This allows
continuous checking of script's validity as it is being created
and/or modified. As compilation is quite time expensive
operation you may experience slower performance especially when
working with a large script. To switch off this feature or to
modify the time out value open the Preferences
window and navigate to Scripting -> Execution. If you
switch it off the editor will not report syntax errors until you
either compile the script manually or execute it.
When the compilation process discovers errors in the script:
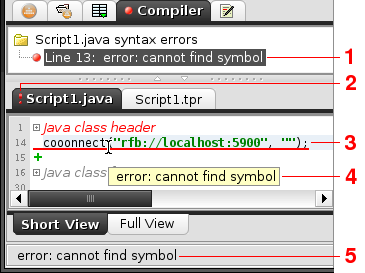
- The Compiler
tab icon turns to a red ball and its pane displays the list of
script errors. Clicking onto an error will jump to the
corresponding line in the editor. A right click onto an error
allows to copy it into the clipboard. See also the Compiler Tab topic.
- The editor tab displays a red
exclamation mark icon to indicate that the script contains
errors.
- The editor line which contains the
error gets underlined in red. The underline color is
configurable through the Appearance & Accessibility ->
Script Editor panel of the Preferences window.
- The error message gets displayed in
form of a tool tip whenever the mouse pointer is hovered above
the line.
- When the caret (dot) is on the
corresponding editor line the error message is also displayed in
the status bar.
5. Executing Test Scripts
Script opened in the active editor can be executed using the
controls in the Script menu of the
main GUI window or their corresponding tool bar buttons.
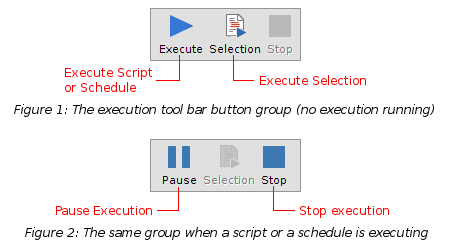
When there are both a schedule
and a test script opened in the GUI the 
Execute
script from the context menu.
While the script or its part (see Execute
Selection) is being executed, the 
 Pause
button. It allows to pause the script or schedule. Setting the
pause on doesn't apply to the currently executed command which
gets always finished and the script gets suspended at the point of
start of the next command. The Pause functionality is also used by
other features. Break points and the Step
By Step mode set on the pause flag when activated.
Pause
button. It allows to pause the script or schedule. Setting the
pause on doesn't apply to the currently executed command which
gets always finished and the script gets suspended at the point of
start of the next command. The Pause functionality is also used by
other features. Break points and the Step
By Step mode set on the pause flag when activated.
Behavior of script execution is further subject to the flags
(options) located in the Script menu:
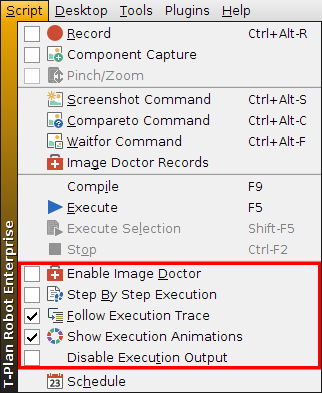
 Enable
Image Doctor controls the Image
Doctor which allows to resolve image comparison failures
in executed test scripts.
Enable
Image Doctor controls the Image
Doctor which allows to resolve image comparison failures
in executed test scripts.-
 Step By Step
Execution pauses the script after every command,
allowing to execute one command at a time.
Step By Step
Execution pauses the script after every command,
allowing to execute one command at a time.

-

- Disable Execution Output disables all script
and schedule file output such as reports, logs and screen shots.
This option may be also set externally through the
--nooutput
CLI option.
Execute Selection (Block Execution)
The editor allows to execute
just a block of commands instead of the whole script. To
do so select (highlight) the lines you want to execute and select
the
The following rules apply to the block execution in a TPR test script:
- All procedures and variables defined in the script before the
selected code will be correctly defined and they may be
referenced in the selected commands.
- Execution of commands from inside of a procedure is not
allowed. The selected block may only call the procedures.
- Execution of an incomplete Java code block is
not supported.
Block execution in Java test
scripts is supported since v3.1. The following rules
apply:
- Only code from the main try-catch block of the test() method can be
selected and executed.
- The selected block must form a compilable piece of code. For
example, if the code relies on a local Java variable which is
declared outside of the selection the block fails to execute.
Execution Tracing
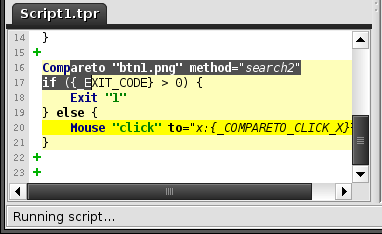
As you may also see on the picture above the editor highligts the currently executed
command line in yellow (or any other custom color).
Depending on your prefereneces the tool even switches among editors
and scrolls the view to show the executed line. This feature enables
user to trace the currently executed command. Its behavior is
controlled by two flags:
- The Open Included Files During
Script Execution flag available in the Scripting ->
Execution panel of the Preferences
window. When you execute a script it might run or include other
scripts using the Run or Include commands. This flag
defines whether T-Plan Robot Enterprise should open these linked scripts in
a new editor as they get executed.
- The
Execution tracing is also supported in Java test scripts but it is
limited only to Java
Test Script API method calls.
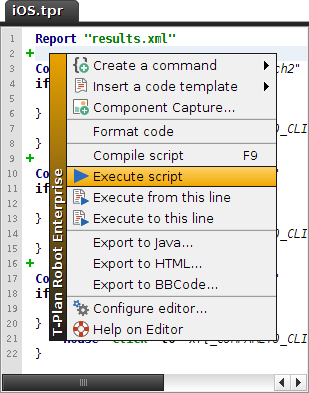
Debugging
Debugging of test scripts is supported by Breakpoints and the Step By Step Execution capabilities. A breakpoint
pauses execution of a script on a certain line. Once a breakpoint is
reached, the script gets paused and won't resume until you deselect
the Pause
menu item or toolbar button.
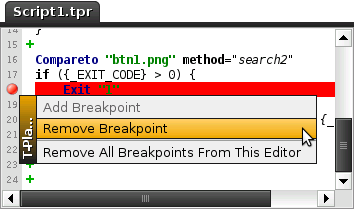
To define a breakpoint
click onto the editor gutter. The line to the right from the click
point must contain a valid command
(TPR scripts) or a Java Test Script API method call. (Java test scripts). The editor line
turns red and the gutter displays a red globe icon. Another way of
break point creation is to right click the gutter and select Add Breakpoint
in the context menu. The breakpoints can be removed in a similar
way. The menu also provides a way to remove all breakpoints in the
editor. See the following picture which shows activated popup menu
for an already existing breakpoint.
There's a Step By Step Execution menu item and
toolbar button which allow you to execute just one line of code at a
time. The following rules apply:
- When the Step
By Step feature is on, the execution gets paused on
every line and you have to unpause to proceed to the next line.
- If the script line contains a command which involves execution
of other commands located in a different file, the behavior
depends on two flags, Open
Included Files During Script Execution flag (configurable
via Preferences->Scripting) and the
Follow Execution Trace menu item. This applies
mainly to procedure calls and command Run:
- If both flags are on, the file gets opened in an editor and
the involved commands are also executed step by step.
- If at least one of the flags is off, the command gets
executed in one shot, e.g. the whole procedure or file is
executed at once.
To configure any color used for the execution control open the Preferences window and navigate to the
Appearance & Accessibility->Script Editor tree node.
Another interesting editor feature is that you can actually edit a TPR script which is being
executed. If you modify code which hasn't been executed
yet, your changes will be picked up as the execution reaches the
changed code. This is possible because the proprietary test script
interpret uses internally the Document Object Model (DOM) to
determine which line (element) is to be executed next. This feature
allows together with break points and step-by-step execution easy
and comfortable debugging of test scripts.